
When a WordPress page suddenly goes blank, shows a critical error, or returns a 500 response, it is natural to assume the site is down for good. These WordPress errors tell you something failed, but the logs help you investigate why.
You can get from that alarming screen to a useful answer without guessing or making a risky change first. This guide will help you follow the trail safely, without exposing technical details to visitors.
TL;DR: Start with your host’s PHP or web-server logs. If needed, temporarily enable WordPress logging with display off, reproduce the failure, and inspect the newest matching entry. Keep your security plugin active, but do not use it as a replacement for WordPress, PHP, web-server, or host logs. Turn debugging off and protect or remove the log when finished.
What is a WordPress error log?
With that safety-first approach in mind, treat a WordPress error log as a time-stamped record of runtime or service events. Think of it as one set of footprints in a larger trail. It can show a PHP error, a warning from a plugin or theme, a failed request, or another event near the time the site broke. The record helps narrow the search; it is not a complete diagnosis, and one warning is not automatically the cause of the visible problem.

The phrase “WordPress error log” can also mean several different records. Think of them as different parts of the same trail: WordPress debug logging, PHP errors, web-server errors, access requests, activity changes, and WooCommerce or email-service events answer different questions. The fastest path is to match the record to the symptom instead of turning on every kind of logging at once.
If you need to see how those records fit together, continue with this broader WordPress logs information after you identify the kind of evidence your problem needs.
Logs are especially useful when you need to investigate:
- A site that has crashed, is unresponsive, or site will not load.
- An HTTP failure or a broken page or request.
- A plugin or theme that has stopped working properly.
- An unexplained slowdown or suspicious site activity.
Check the host logs first
Once you know that a log is evidence rather than a verdict, follow the trail from the records your host may already collect. Look in the host dashboard for an error log, PHP log, server log, monitoring report, or a similar tool. The menu name and available detail vary by provider, so do not assume that every site has the same panel or file path.
If the host provides file access, the same records may be available through a file manager, SFTP or FTP, SSH, or WP-CLI. SFTP and FTP transfer files, SSH provides a command-line connection, and WP-CLI is a command-line tool for managing WordPress.
Those routes are access methods, not universal locations. If you cannot find the log or do not have the required access, ask the host to identify the PHP and web-server entries for the time of the failure.
This route is especially useful when WordPress does not load far enough to write its own debug entry. A PHP fatal error, web-server failure, or resource problem can occur below the WordPress application layer. The host may therefore have evidence that wp-content/debug.log does not.
📝 Note: A staging site is a separate copy used for testing. If the failure is risky to reproduce, use staging or ask the host to help collect the records instead of repeatedly triggering it on a live site.
Enable WordPress debug logging temporarily
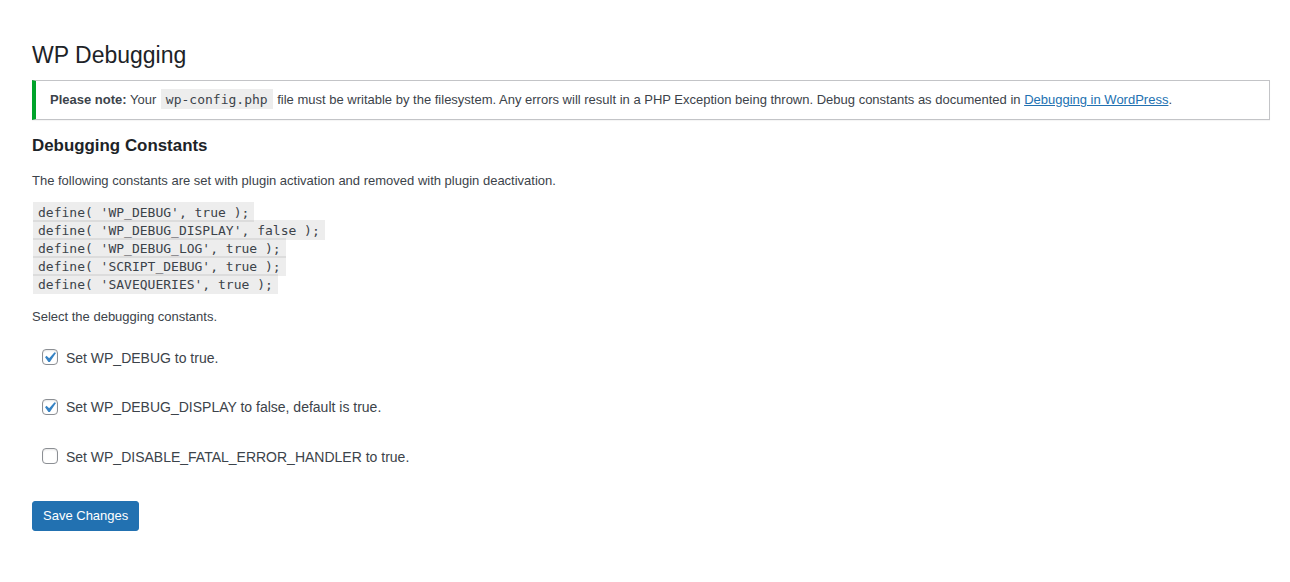
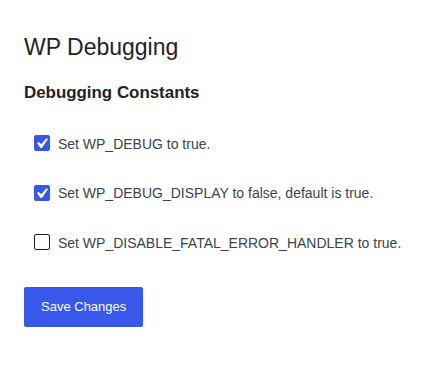
If the host trail does not explain a plugin, theme, or custom-code problem, temporarily enable WordPress debugging for a short period. Edit wp-config.php, the configuration file for the WordPress installation, through the host’s supported file or recovery method and add these constants before the line that says “That’s all, stop editing! Happy blogging.”:

define( 'WP_DEBUG', true );
define( 'WP_DEBUG_LOG', true );
define( 'WP_DEBUG_DISPLAY', false );
WP_DEBUG turns on WordPress debugging. WP_DEBUG_LOG saves the messages to a file and requires WP_DEBUG to be true. With the usual configuration, the file is wp-content/debug.log. A valid custom path can be supplied to WP_DEBUG_LOG when the site’s hosting setup requires a different location.
WP_DEBUG_DISPLAY set to false keeps the diagnostic messages out of generated pages while leaving them available in the log. This matters on a live site because displayed errors can reveal file paths, usernames, queries, and other implementation details to visitors. Use the Boolean value false, not the quoted string ‘false’. In PHP, a quoted string is not the same setting.
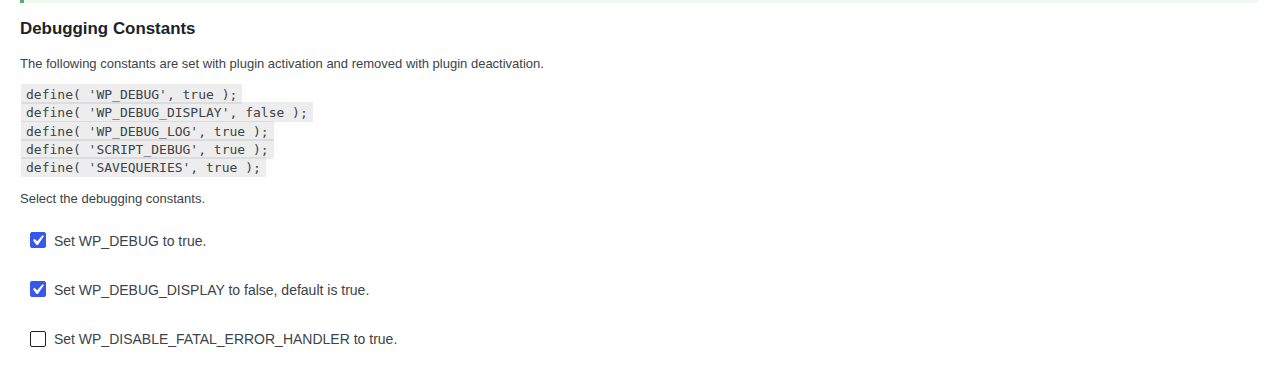
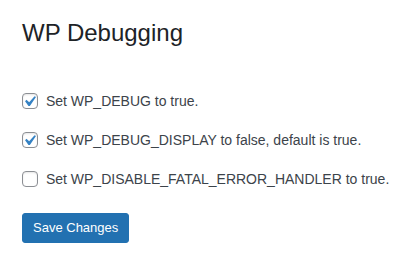
If you still have dashboard access, a suitable debugging plugin can offer a guided alternative to editing wp-config.php. Check what it changes, keep diagnostic output hidden, and deactivate it when troubleshooting is complete. A plugin is a convenience, not a replacement for the host, PHP, web-server, or WordPress records that may contain the evidence you need.
Keep debugging temporary and keep diagnostic output off the page while you investigate.
Make a backup or use the host’s supported recovery process before editing the configuration file. Do not disable a security plugin casually just to change a protected file. If the dashboard is unavailable, work through the host or a staging copy instead.
Reproduce the failure and find the matching entry
Once logging is configured, retrace the action that created the symptom. Turning on logging does not recreate an earlier event. Open the page, submit the form, run the update, or repeat the plugin or theme action that caused the problem. A log can stay empty until the failing request happens again.
Then inspect the newest entries around that time. Useful details include:

- Match the timestamp so the entry can be tied to the action.
- Read the severity and message to understand whether the entry describes a warning, fatal error, or another failure.
- Identify the named component such as a file, plugin, theme, or other part of the request.
- Check the line or surrounding context when the log includes it.
- Compare the entry with the recent change and the failing URL or action.
A repeated message that appears each time the same action fails is more useful than an isolated old warning. Check related host or service logs when the WordPress entry points outside the application. Treat the entry as evidence for the next test, not as permission to edit production code blindly.
Choose the log that matches the symptom
Once you have a matching entry, follow that trail to decide whether another record can answer the question more directly:
Plugin, theme, or custom-code failure
Start with the WordPress debug log and the PHP error log. These can identify a WordPress fatal error, warning, missing function, incompatible call, or file associated with the code path. A suspected plugin or theme change should be tested safely, preferably on staging or after a reliable backup.
500 response or a page that never loads
Check the host’s PHP and web-server error logs as well as the WordPress debug log. An HTTP 500 error in WordPress can come from the web server or PHP before WordPress records a useful application message. The host may need to correlate the request time with its server-side records.
404, redirect, or failed request
Use the access log and web-server log to see which request arrived and how the server handled it. The WordPress debug log may not record every request-level routing or server problem. A 404 error or an unfamiliar IP address is not, by itself, proof that the site was hacked.
An unexplained change in the site
Use an activity log to investigate recognized changes, not PHP failures. It may record recognized plugin, theme, file, or user changes when an activity logger was active. Use it to investigate who or what changed the site, then use runtime and server logs to investigate what failed. A runtime warning alone cannot establish that a change was unauthorized.
WooCommerce, email, database, or another service failure
Check the service’s own logs or reports along with the WordPress and host logs. An order, email, database, or external-service problem may have a record that is more specific than a general PHP warning. The exact location depends on the service and hosting setup.
Why is debug.log empty?
If the WordPress trail seems to end, an empty or missing file does not always mean logging is broken. Here’s where I see people usually trip up: the failing request may not have been reproduced, logging may have been enabled after the event, the constants may be below the stop-editing marker, a host configuration may use another path, or another setting may override the expected behavior.
Check the Boolean values and spelling, confirm that WP_DEBUG and WP_DEBUG_LOG are both enabled, and repeat the failing action. Confirm that the configured path is writable and that you are checking the correct site when several installations share a server. If the file still contains nothing, return to the host’s PHP and web-server logs or ask the provider where those records are stored.
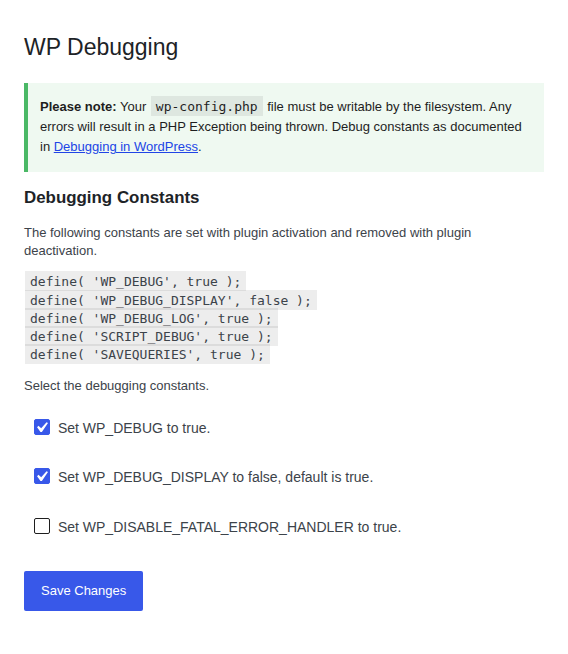
Before enabling more settings, check:
- The constants and their values, including their placement before the stop-editing marker.
- The configured path and whether the site can write to it.
- Whether a security plugin or host configuration is protecting or overriding the file.
If WordPress cannot write to the configured path, check the relevant WordPress file permissions and ownership with your host rather than making the folder writable by everyone.
Do not solve an empty log by enabling every debugging option. SAVEQUERIES, for example, can help inspect database queries but adds a performance cost. It should not remain enabled after troubleshooting, and it is not the first setting needed for an ordinary plugin or theme failure.
Turn debugging off when you finish
Once the trail gives you enough evidence to choose the next test, turn temporary debugging off. Debug logging is a temporary troubleshooting setting. After collecting the relevant entries, change the constants back to the site’s normal configuration or remove the temporary definitions. If SAVEQUERIES was enabled, turn it off as well.
Use this cleanup checklist:
- Turn off temporary debug settings.
- Deactivate a debugging plugin or remove temporary configuration lines.
- Protect, archive, or remove the resulting log when the support process allows.
If troubleshooting required changes to the configuration file’s access controls, review how to secure wp-config.php and restore the appropriate protections when finished.
Protect the log while it exists, and remove or archive it when the site’s security and support process allows. Raw logs can contain private paths, usernames, queries, tokens, customer data, or other sensitive details. Do not paste unredacted lines into a public support request. Share only the smallest useful excerpt after removing secrets and private data.
When sharing evidence:
- Remove credentials, tokens, customer data, and private paths.
- Share only the smallest excerpt that supports the question.
- Keep security investigation separate from ordinary PHP debugging unless other evidence points to compromise.
The log may point to a plugin, theme, configuration, resource limit, or server problem, but it does not fix that problem. Make one safe change at a time, test the original failing action, and keep a backup or rollback path. Contact the host when the evidence points to PHP, the web server, a limit, or a service outside WordPress.
Escalate to a WordPress security audit when there is corroborating evidence of suspicious access or unauthorized changes, rather than treating an ordinary warning as proof of compromise.
FAQs
Where is the WordPress debug log?
When WP_DEBUG and WP_DEBUG_LOG are enabled with the usual configuration, it is commonly at wp-content/debug.log. A custom WP_DEBUG_LOG path, a host-managed log, or a server configuration can put the useful record somewhere else.
How do I enable WordPress error logging?
Use the host’s supported debugging tool, a suitable debugging plugin when dashboard access is available, or the wp-config.php constants WP_DEBUG, WP_DEBUG_LOG, and WP_DEBUG_DISPLAY=false. Keep display disabled while troubleshooting a live site, reproduce the problem, and turn the setting off afterward.
Why is my WordPress error log empty?
The failure may not have been reproduced since logging was enabled, the constants may be misplaced or overridden, the file may not be writable, or the host may use a different log. Repeat the failing action and check the host’s PHP and web-server records if the WordPress file remains empty.
Should I leave WP_DEBUG turned on?
No. Treat it as temporary troubleshooting configuration. Leaving debugging or query logging enabled can expose implementation details, increase storage or performance costs, and create a log that contains sensitive information.
Can an error log prove that my WordPress site was hacked?
No. An error log can show suspicious behavior or a failing code path, but a warning, 404, or unfamiliar IP is not enough to prove compromise. Investigate activity records, affected files, user changes, signs of a hacked WordPress site, and other security evidence before deciding what happened.
Conclusion
The safest way to check WordPress error logs is to start with the host’s records, then use temporary WordPress debug logging when the problem is inside a plugin, theme, or custom code path. Keep errors out of page output, reproduce the failure, match the newest entry to the action, and remember that PHP, server, access, activity, and service logs answer different questions.
Your next step is to save a backup or confirm a rollback path, collect a short time-bounded sample, and disable debugging as soon as you have enough evidence. Use the result to make one controlled change, contact the host, or begin a separate security investigation based on what the logs actually show.